MongoDB vs Postgres JSONB in 2026: Inserts, Lookups, Updates and Storage, Benchmarked
I loaded the same 200,000 order documents into MongoDB 9.0 and PostgreSQL 18 JSONB and measured inserts, indexed lookups (GIN vs B-tree), containment filters, nested updates, aggregations and disk size.


On this page
Most "MongoDB vs Postgres JSONB" debates are fought with benchmarks from 2014 and opinions from Twitter. I run both in my day job and side projects, so I put the current versions, MongoDB 9.0.4 (released October 13, 2026) and PostgreSQL 18.6, on the same VM, loaded the same 200,000 order documents into each, and measured the things a real app does all day: inserts, lookups by an indexed field, containment filters, partial updates of nested fields, aggregations and disk usage.
The short version: neither one wins everywhere. Postgres answered B-tree indexed reads more than twice as fast through the Node.js drivers, but MongoDB loaded data almost 4x faster, updated nested fields about 50% faster and used 5.6x less disk. And one index choice that most JSONB tutorials recommend, a GIN index on the whole document, turned out to be the most expensive line in my Postgres schema.
TL;DR: MongoDB vs Postgres JSONB#
If your app is relational with some flexible fields, keep it in Postgres and index the JSONB paths you query with B-tree expression indexes, not one big GIN index. If your data really is documents that get written and updated a lot, and disk or cache size matters, MongoDB did that work faster and far more compactly in my tests.
How I tested#
Everything ran on one Linux VM: 8 vCPUs (Intel Xeon, KVM), 16 GB of RAM, Debian 13. The databases and the Node.js client shared the machine and talked over loopback TCP, so there's no network latency in these numbers. The VM is shared with other workloads, so I logged the load average and free memory with every result and re-ran everything after one early run stalled (more in the limitations).
- PostgreSQL 18.6 (PGDG build) in its own cluster with
shared_buffers = 512MB,max_wal_size = 4GBand otherwise default settings, includingfsync = onandsynchronous_commit = on. - MongoDB 9.0.4 Community, the official Debian 12 tarball, as a standalone server with
--wiredTigerCacheSizeGB 0.5so both databases got the same 512 MB of cache. Everything else default: snappy compression, journaling on, default write concern. - Node.js 22.20.0 with
pg8.23.1 andmongodb7.7.0, the latest npm releases on October 29, 2026. - Data: 200,000 generated e-commerce orders from a seeded random generator, the same documents for both databases. Each order has a customer, status, total, tags, a nested
shippingobject, 1 to 5 line items and aneventsarray. That's about 770 bytes as JSON, 979 bytes per row as JSONB and 806 bytes as BSON. - Method: 16 concurrent clients (a 16-connection pool on both sides) in a closed loop for 10 seconds per test, 3 runs per test, and I report the median. Aggregations ran 5 times per run.
Every query I timed returned the same answer on both databases: for example, both found exactly 1,411 orders that are shipped, going to the UAE and tagged gift, and both aggregations returned identical totals.
The schema and the indexes#
Postgres gets one jsonb column plus an identity key. To compare the two ways people index JSONB, I created both: a GIN index over the whole document and B-tree expression indexes on the fields the app looks up.
CREATE TABLE orders (
  id  bigint GENERATED ALWAYS AS IDENTITY PRIMARY KEY,
  doc jsonb NOT NULL
);
-- one index for any containment query (@>)
CREATE INDEX orders_gin ON orders USING gin (doc jsonb_path_ops);
-- B-tree expression indexes for the hot lookups
CREATE UNIQUE INDEX orders_orderno ON orders ((doc->>'orderNo'));
CREATE INDEX orders_customer ON orders
(((doc->>'customerId')::int), (doc->>'createdAt') DESC);db.orders.createIndex({ orderNo: 1 }, { unique: true });
db.orders.createIndex({ customerId: 1, createdAt: -1 });
db.orders.createIndex({ status: 1, "shipping.country": 1 });
db.orders.createIndex({ tags: 1 });Two things to know about the Postgres side. The query has to match the index: doc->>'orderNo' = $1 uses the B-tree, doc @> '{"orderNo": "..."}' uses the GIN index, and neither one can use the other's index. And JSONB has no date type, so createdAt is an ISO 8601 string. It sorts correctly as text, but in MongoDB it's a real Date.
Insert throughput#
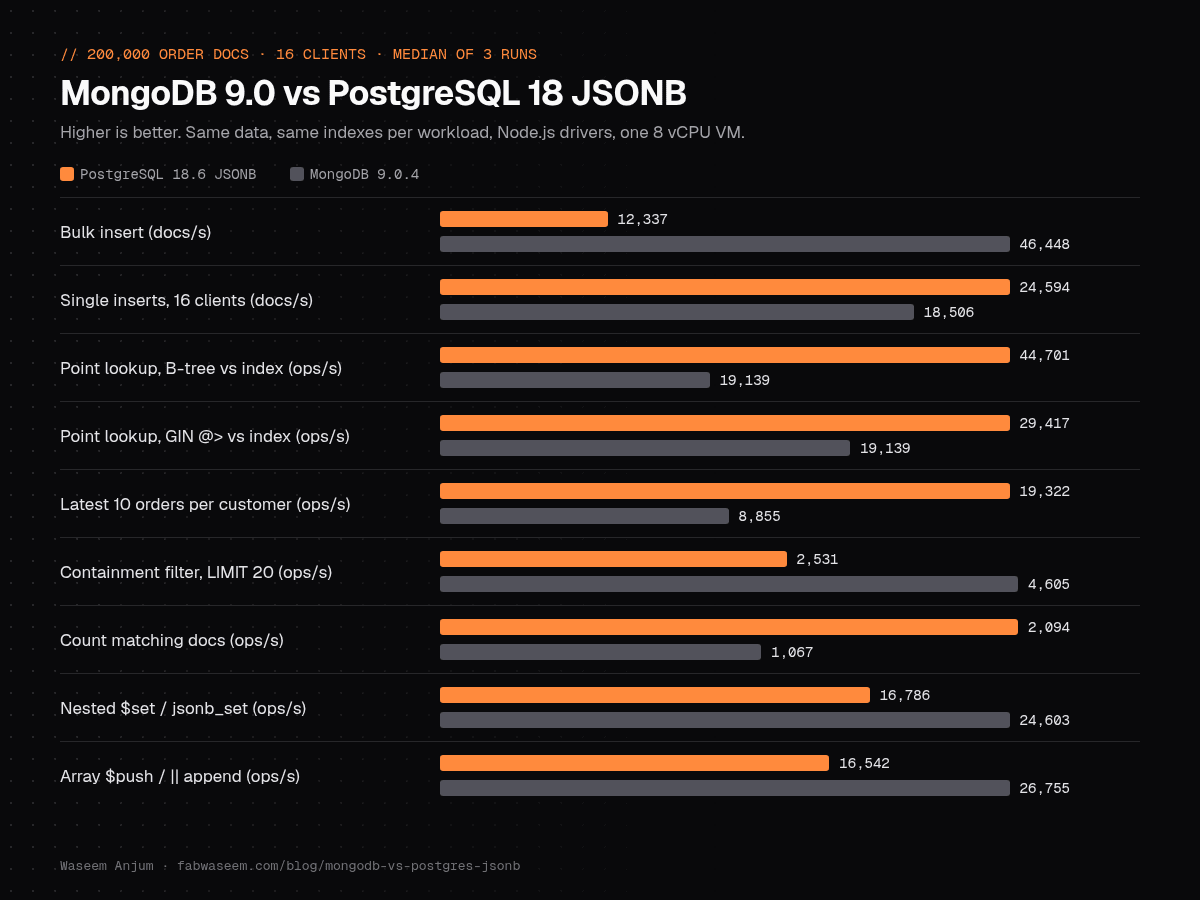
For bulk loads MongoDB was 3.8x faster: 200,000 orders in 4.3 seconds against 16.2 seconds for Postgres with a multi-row INSERT ... SELECT unnest($1::jsonb[]). Half of the Postgres cost was the GIN index. Without it the same load ran at 26,918 docs/s, 2.2x faster.
Single inserts flipped the result. With 16 clients each inserting one document at a time, Postgres did 24,594 per second with every commit flushed to the WAL. Postgres groups concurrent commits into one flush, which is why durability cost it so little here. MongoDB's default write concern gave 18,506 inserts per second, and asking it to wait for the journal on every insert ({ j: true }) gave 16,070.
Point lookups: GIN vs B-tree expression index vs MongoDB index#
Fetching one order by its unique orderNo is the most common query in most apps.
The B-tree expression index was the fastest way to find one document in either database, and 52% faster than the GIN index on the same table. EXPLAIN shows why: the B-tree query is a plain index scan, while the GIN query is a bitmap index scan plus a bitmap heap scan with a recheck, and the planner guessed 20 matching rows for a unique value because it has no real statistics for containment. With GIN you also pay for an index that covers every key and value in the document.
MongoDB's own query planner used its fast EXPRESS_IXSCAN path, and with one client its p50 (0.076 ms) sat between the two Postgres indexes. With 16 clients it delivered less than half the throughput of the B-tree. I didn't profile the client side, but part of the gap is likely decoding: pg hands JSONB to V8's native JSON.parse, while the MongoDB driver decodes BSON in JavaScript.
Customer feed: the latest 10 orders#
A compound index on customer and date, then ORDER BY ... LIMIT 10. Both databases read the index backwards from the newest entry and stopped after 10 rows.
Postgres returned the 10 documents 2.2x faster. Same pattern as the point lookups: when the access path is a known B-tree, Postgres plus pg moved more rows per second.
Containment filters and counts#
Now an ad-hoc filter: orders with a given status, shipping country and tag, such as shipped to the UAE with the gift tag. In Postgres that's one @> against the GIN index. In MongoDB it's a normal filter that used the { status, shipping.country } index and checked tags on the fetched documents.
SELECT doc FROM orders
WHERE doc @> '{"status": "shipped", "shipping": {"country": "AE"}, "tags": ["gift"]}'
LIMIT 20;db.orders.find({ status: "shipped", "shipping.country": "AE", tags: "gift" }).limit(20);MongoDB was 1.8x faster at returning the first 20, because it can walk the compound index and stop as soon as it has 20 documents. Postgres builds a bitmap from the GIN index for all matches before it reads the first row, so LIMIT 20 saves less. For a full count Postgres was 2x faster: the GIN index matched all three conditions at once, while MongoDB had to fetch every shipped UAE order to check its tags. A tags field in MongoDB's compound index would change that, and so would a B-tree on the hot fields in Postgres. The point is that GIN gives you decent speed on any combination of fields without planning indexes, not the best speed on any one of them.
Partial nested updates#
Updating one nested field is where the two storage engines differ the most. Here are three updates by orderNo: set shipping.status and updatedAt, push an event onto the events array, and increment a counter.
-- Postgres
UPDATE orders
SET doc = jsonb_set(doc, '{shipping,status}', to_jsonb($2::text))
WHERE doc->>'orderNo' = $1;

UPDATE orders
SET doc = jsonb_set(doc, '{events}',
  (doc->'events') || jsonb_build_array(jsonb_build_object('type', $2::text, 'at', now())))
WHERE doc->>'orderNo' = $1;// MongoDB
db.orders.updateOne({ orderNo }, { $set: { "shipping.status": status, updatedAt: new Date() } });
db.orders.updateOne({ orderNo }, { $push: { events: { type: "note", at: new Date() } } });
db.orders.updateOne({ orderNo }, { $inc: { views: 1 } });MongoDB was about 50% faster than Postgres with the full set of indexes. jsonb_set reads like a partial update, but Postgres stores JSONB as one value, so every update writes a complete new copy of the row. Worse, it can't be a HOT (heap-only tuple) update once any index is built on an expression over doc, because Postgres only knows the indexed column changed. I checked this on a small table: 5,000 jsonb_set updates gave 0 HOT updates with a doc->>'orderNo' index and 2,215 without it. So every update also inserts new entries into every index, including the GIN index, which holds an entry for every value in the document. Dropping the GIN index made Postgres updates 32 to 37% faster and closed most of the gap.
Aggregations#
Two reports over all 200,000 orders: revenue and order count per shipping country for shipped and delivered orders, and the 10 best-selling SKUs, which needs unwinding the items array.
SELECT doc->'shipping'->>'country' AS country, count(*) AS n,
       sum((doc->>'total')::numeric) AS revenue
FROM orders
WHERE doc->>'status' IN ('shipped', 'delivered')
GROUP BY 1 ORDER BY 3 DESC;

SELECT i->>'sku' AS sku, sum((i->>'qty')::int) AS qty
FROM orders, jsonb_array_elements(doc->'items') AS i
GROUP BY 1 ORDER BY 2 DESC, 1 LIMIT 10;db.orders.aggregate([
{ $match: { status: { $in: ["shipped", "delivered"] } } },
{ $group: { _id: "$shipping.country", n: { $sum: 1 }, revenue: { $sum: "$total" } } },
{ $sort: { revenue: -1 } },
]);
db.orders.aggregate([
{ $unwind: "$items" },
{ $group: { _id: "$items.sku", qty: { $sum: "$items.qty" } } },
{ $sort: { qty: -1, _id: 1 } },
{ $limit: 10 },
]);A split result. The grouped sum was close (MongoDB took 15% less time, which is inside the run-to-run noise for that Postgres query), and Postgres took 43% less time on the unwind. Postgres used parallel workers for these scans (2 per query by default) and still had to parse ->> paths and cast text to numeric for every row. EXPLAIN ANALYZE showed the revenue query sorting on disk with the default work_mem of 4 MB, which I left untuned. If reports like this matter, move the summed fields into real columns, or raise work_mem for the reporting role.
Storage size#
MongoDB used 5.6x less disk. WiredTiger compresses collections with snappy and indexes with prefix compression by default, so 161 MB of BSON became 46 MB. Postgres only compresses a JSONB value when it's bigger than about 2 KB (the TOAST threshold), and these documents averaged 979 bytes, so none were compressed. The GIN index alone was larger than MongoDB's collection and all five of its indexes together.
Then I ran the update tests from the previous section and measured again. Those runs also grew the documents (new events, a views counter, an updatedAt field), so average document size went up by about a fifth in both databases.
Postgres grew 4x with autovacuum running at default settings, and the GIN index grew 6.5x to 466 MB even though no indexed value changed. MongoDB's indexes stayed the same size, because updating fields that aren't indexed doesn't touch its indexes. Its collection grew to 129.1 MB, of which 67.4 MB was free space WiredTiger will reuse. Postgres will reuse its dead space too after vacuum, but a heavily updated JSONB table with a whole-document GIN index needs much more disk and cache than the same data in MongoDB.
The same operations in Node.js#
This is the module I used to check that each query does the same thing in both databases. A test inserted 3 orders, ran every function against both and asserted identical results. It passed.
import pg from "pg";
import { MongoClient } from "mongodb";

const pool = new pg.Pool({ connectionString: process.env.PG_URL });
const mongo = new MongoClient(process.env.MONGO_URL);
const orders = mongo.db("shop").collection("orders");

// Insert
export const pgInsert = (doc) => pool.query("INSERT INTO orders (doc) VALUES ($1)", [doc]);
export const mgInsert = (doc) => orders.insertOne(doc);

// Point lookup: ->> matches the B-tree expression index; @> would go to GIN
export const pgByOrderNo = async (no) =>
  (await pool.query("SELECT doc FROM orders WHERE doc->>'orderNo' = $1", [no])).rows[0]?.doc;
export const mgByOrderNo = (no) => orders.findOne({ orderNo: no });

// Customer feed: latest 10 orders
export const pgFeed = async (customerId) => (await pool.query(
  `SELECT doc FROM orders WHERE (doc->>'customerId')::int = $1
   ORDER BY doc->>'createdAt' DESC LIMIT 10`, [customerId])).rows.map((r) => r.doc);
export const mgFeed = (customerId) =>
  orders.find({ customerId }).sort({ createdAt: -1 }).limit(10).toArray();

// Containment filter
export const pgFilter = async (status, country, tag) => (await pool.query(
  "SELECT doc FROM orders WHERE doc @> $1::jsonb LIMIT 20",
  [JSON.stringify({ status, shipping: { country }, tags: [tag] })])).rows.map((r) => r.doc);
export const mgFilter = (status, country, tag) =>
  orders.find({ status, "shipping.country": country, tags: tag }).limit(20).toArray();

// Partial nested update
export const pgShip = (no, status) => pool.query(
  `UPDATE orders SET doc = jsonb_set(doc, '{shipping,status}', to_jsonb($2::text))
   WHERE doc->>'orderNo' = $1`, [no, status]);
export const mgShip = (no, status) =>
  orders.updateOne({ orderNo: no }, { $set: { "shipping.status": status } });
Two driver details that cost me time. pg serializes a plain object to JSON for a jsonb parameter, but a JavaScript Date inside it becomes an ISO string, and it comes back as a string. And pg returns numeric and count(*) as strings ("361.5", "3"), while MongoDB returns numbers, so convert before you compare or add.
Which should you choose?#
- Your data is relational and some of it is flexible: Postgres JSONB. Joins, foreign keys, transactions across tables and SQL reporting still matter more than raw document speed for most apps. Use B-tree expression indexes (or generated columns) for the paths you query often. They were the fastest lookups in this whole test.
- Add a GIN index only when you need ad-hoc containment queries. It made any combination of fields queryable, but it halved bulk insert speed, slowed updates by about a quarter and was the biggest object on disk, and it grew fastest under updates. If you only filter on a few known keys, index just those paths, for example a GIN index on
(doc->'tags')queried withdoc->'tags' @> '["gift"]'. It should cost far less, though I didn't measure that variant. - Your data is documents that get written and updated all day: MongoDB. It loaded 3.8x faster, updated nested fields about 50% faster and stored the same orders in 18% of the space, which also means more of your working set fits in RAM.
- Updates are frequent and documents are large: avoid whole-document rewrites in Postgres. Put fast-changing fields like status, counters and timestamps in normal columns next to the JSONB, so updates can be HOT and don't rewrite every index.
If you're also deciding what else Postgres can absorb, I measured Postgres full-text search against Elasticsearch and Meilisearch and Postgres job queues against BullMQ on Redis. For primary keys on big tables, see UUIDv7 in Postgres, and for the ORM layer, Drizzle vs Prisma.
Limitations of this benchmark#
- One VM, a single node of each database, everything on loopback. No replica set, so MongoDB's write concern never waited for a second node, and Postgres had no replica either. Real networks add a round trip to every call.
- 200,000 documents of under 1 KB each, which fits in RAM. With a working set larger than memory, MongoDB's 5.6x smaller footprint would likely matter even more, but I didn't test that.
- The VM is shared with other workloads. My first full run stalled for about a minute while the VM was almost out of free memory, so I discarded it and re-ran everything. Then MongoDB crashed mid-run because a snapshot agent on the VM dropped a temporary file into its journal folder, so I restarted it with log file removal turned off (
log=(remove=false)) and re-ran all MongoDB tests from scratch. Most tests stayed within 10% of their median across the 3 runs, but a few varied by up to 47% (one Postgres aggregation run, the GIN lookups and some update runs). That's why I report medians, and why I'd treat any gap under about 20% as noise. - Node.js drivers on both sides, so client-side decoding (JSON vs BSON) is part of every read number.
- I didn't tune
work_mem, autovacuum or fillfactor in Postgres, or anything in MongoDB beyond the cache size. I also didn't test transactions, sharding, schema validation or change streams.
Questions
Share